Speed.
Threshold.
Base.
Tested.
Part of our running series. Speed, Threshold, Base covered the three phases of run training. Run Better by Running Less covered why less can be more. This one puts both to the test on my own training, and stacks it next to my 2017 Alaskaman build.
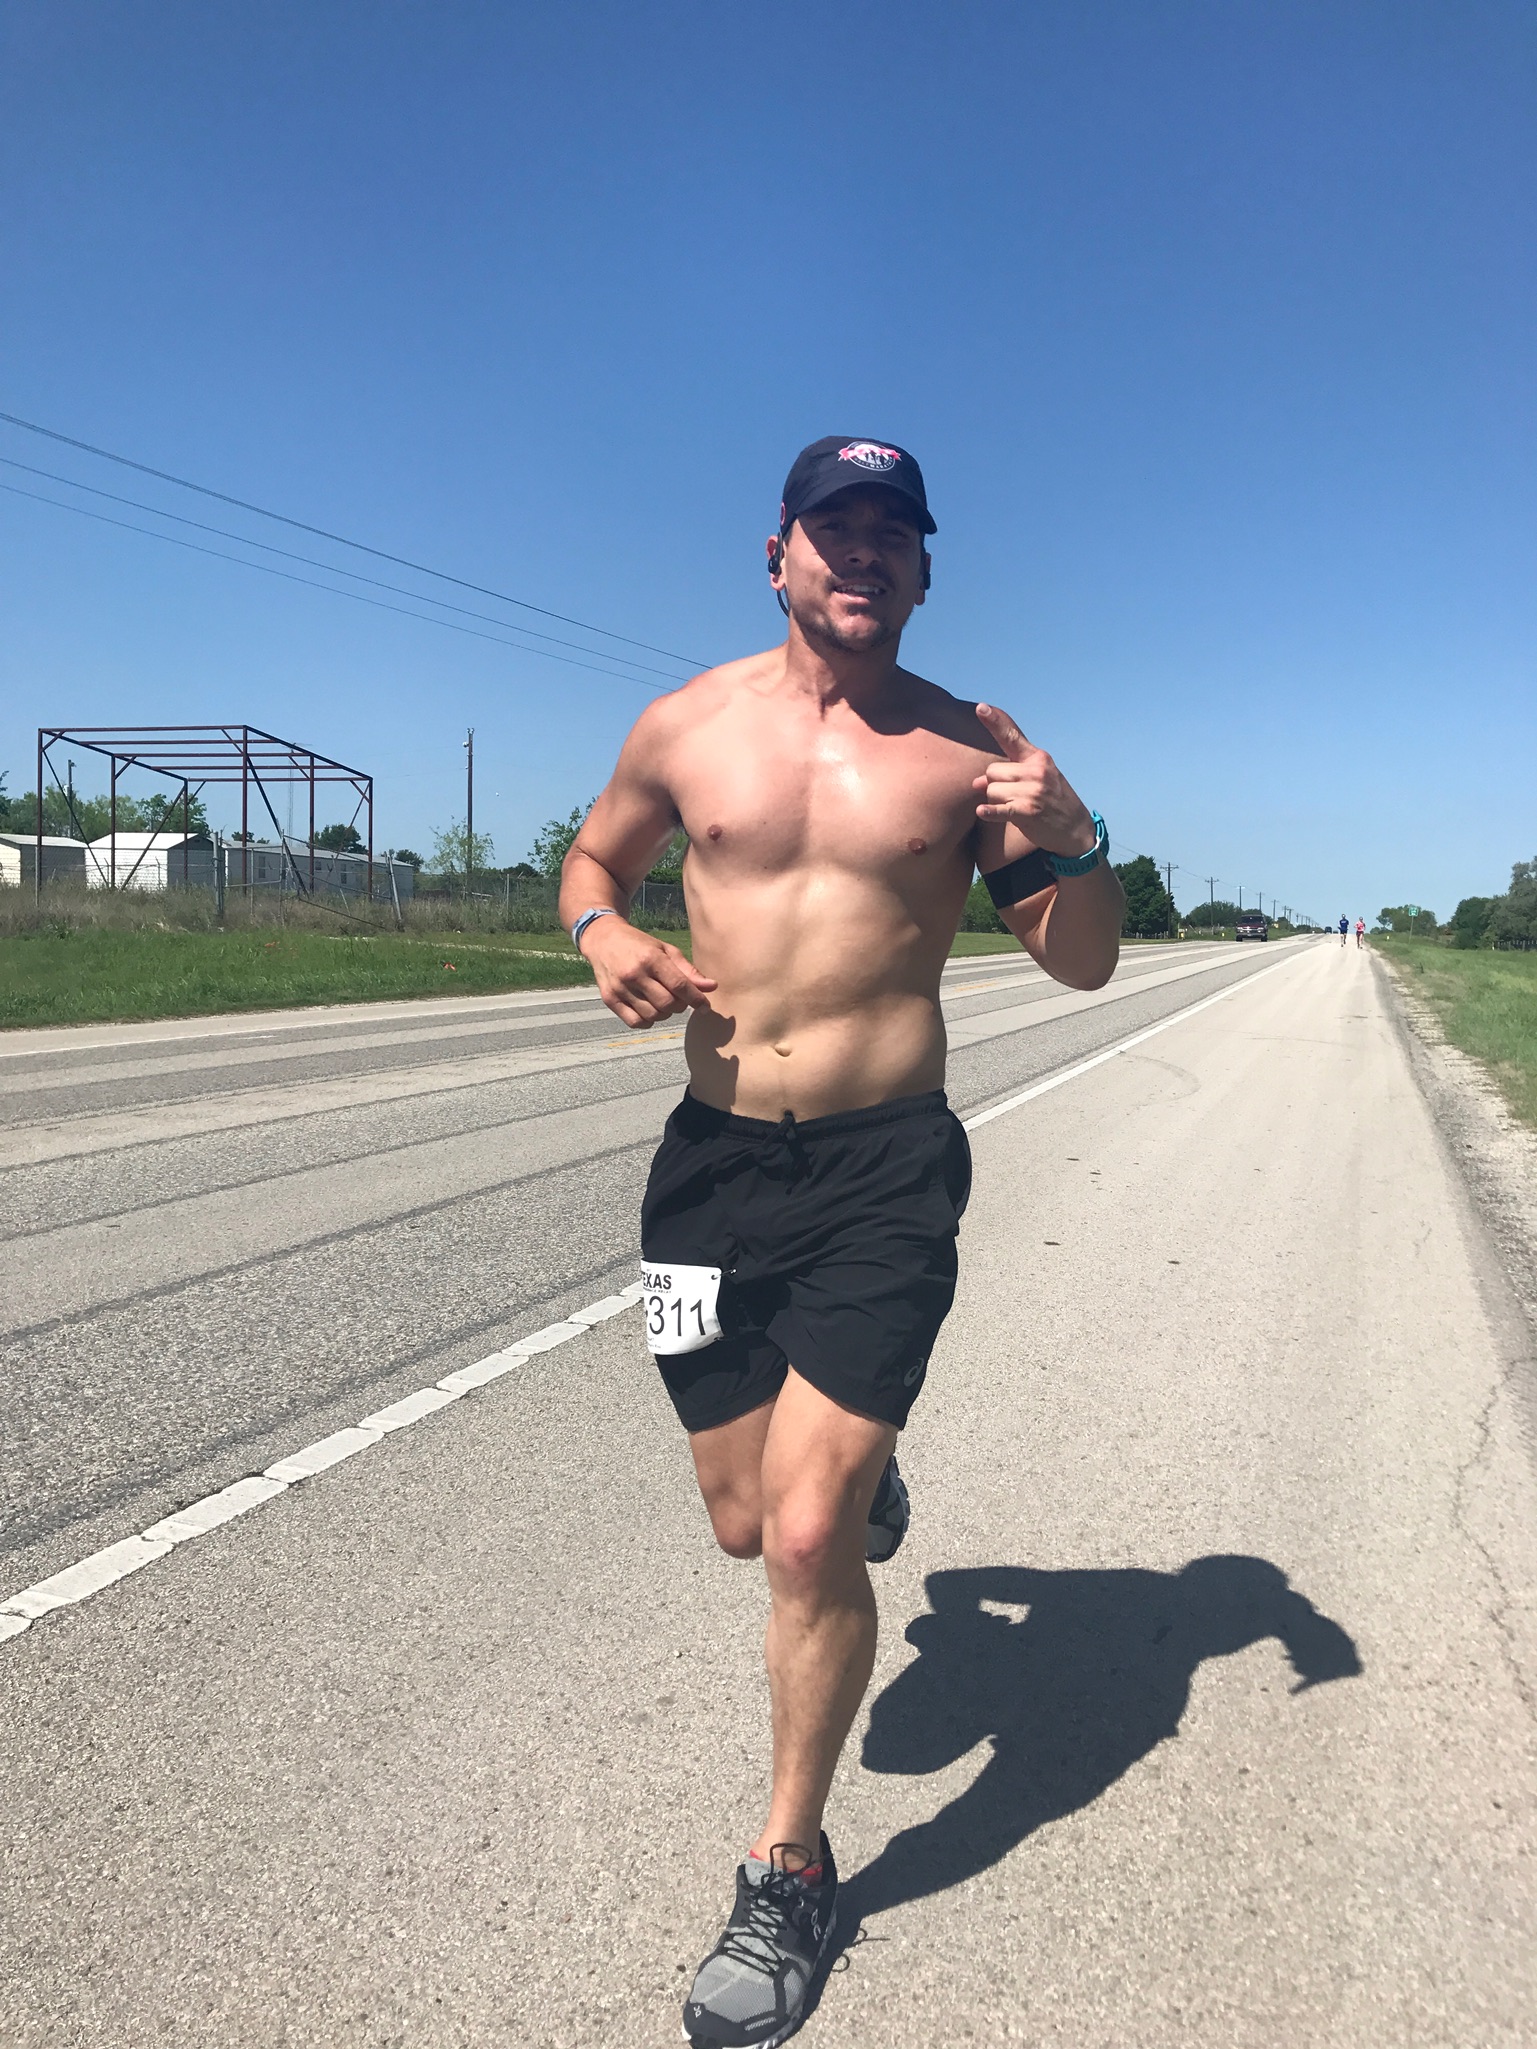
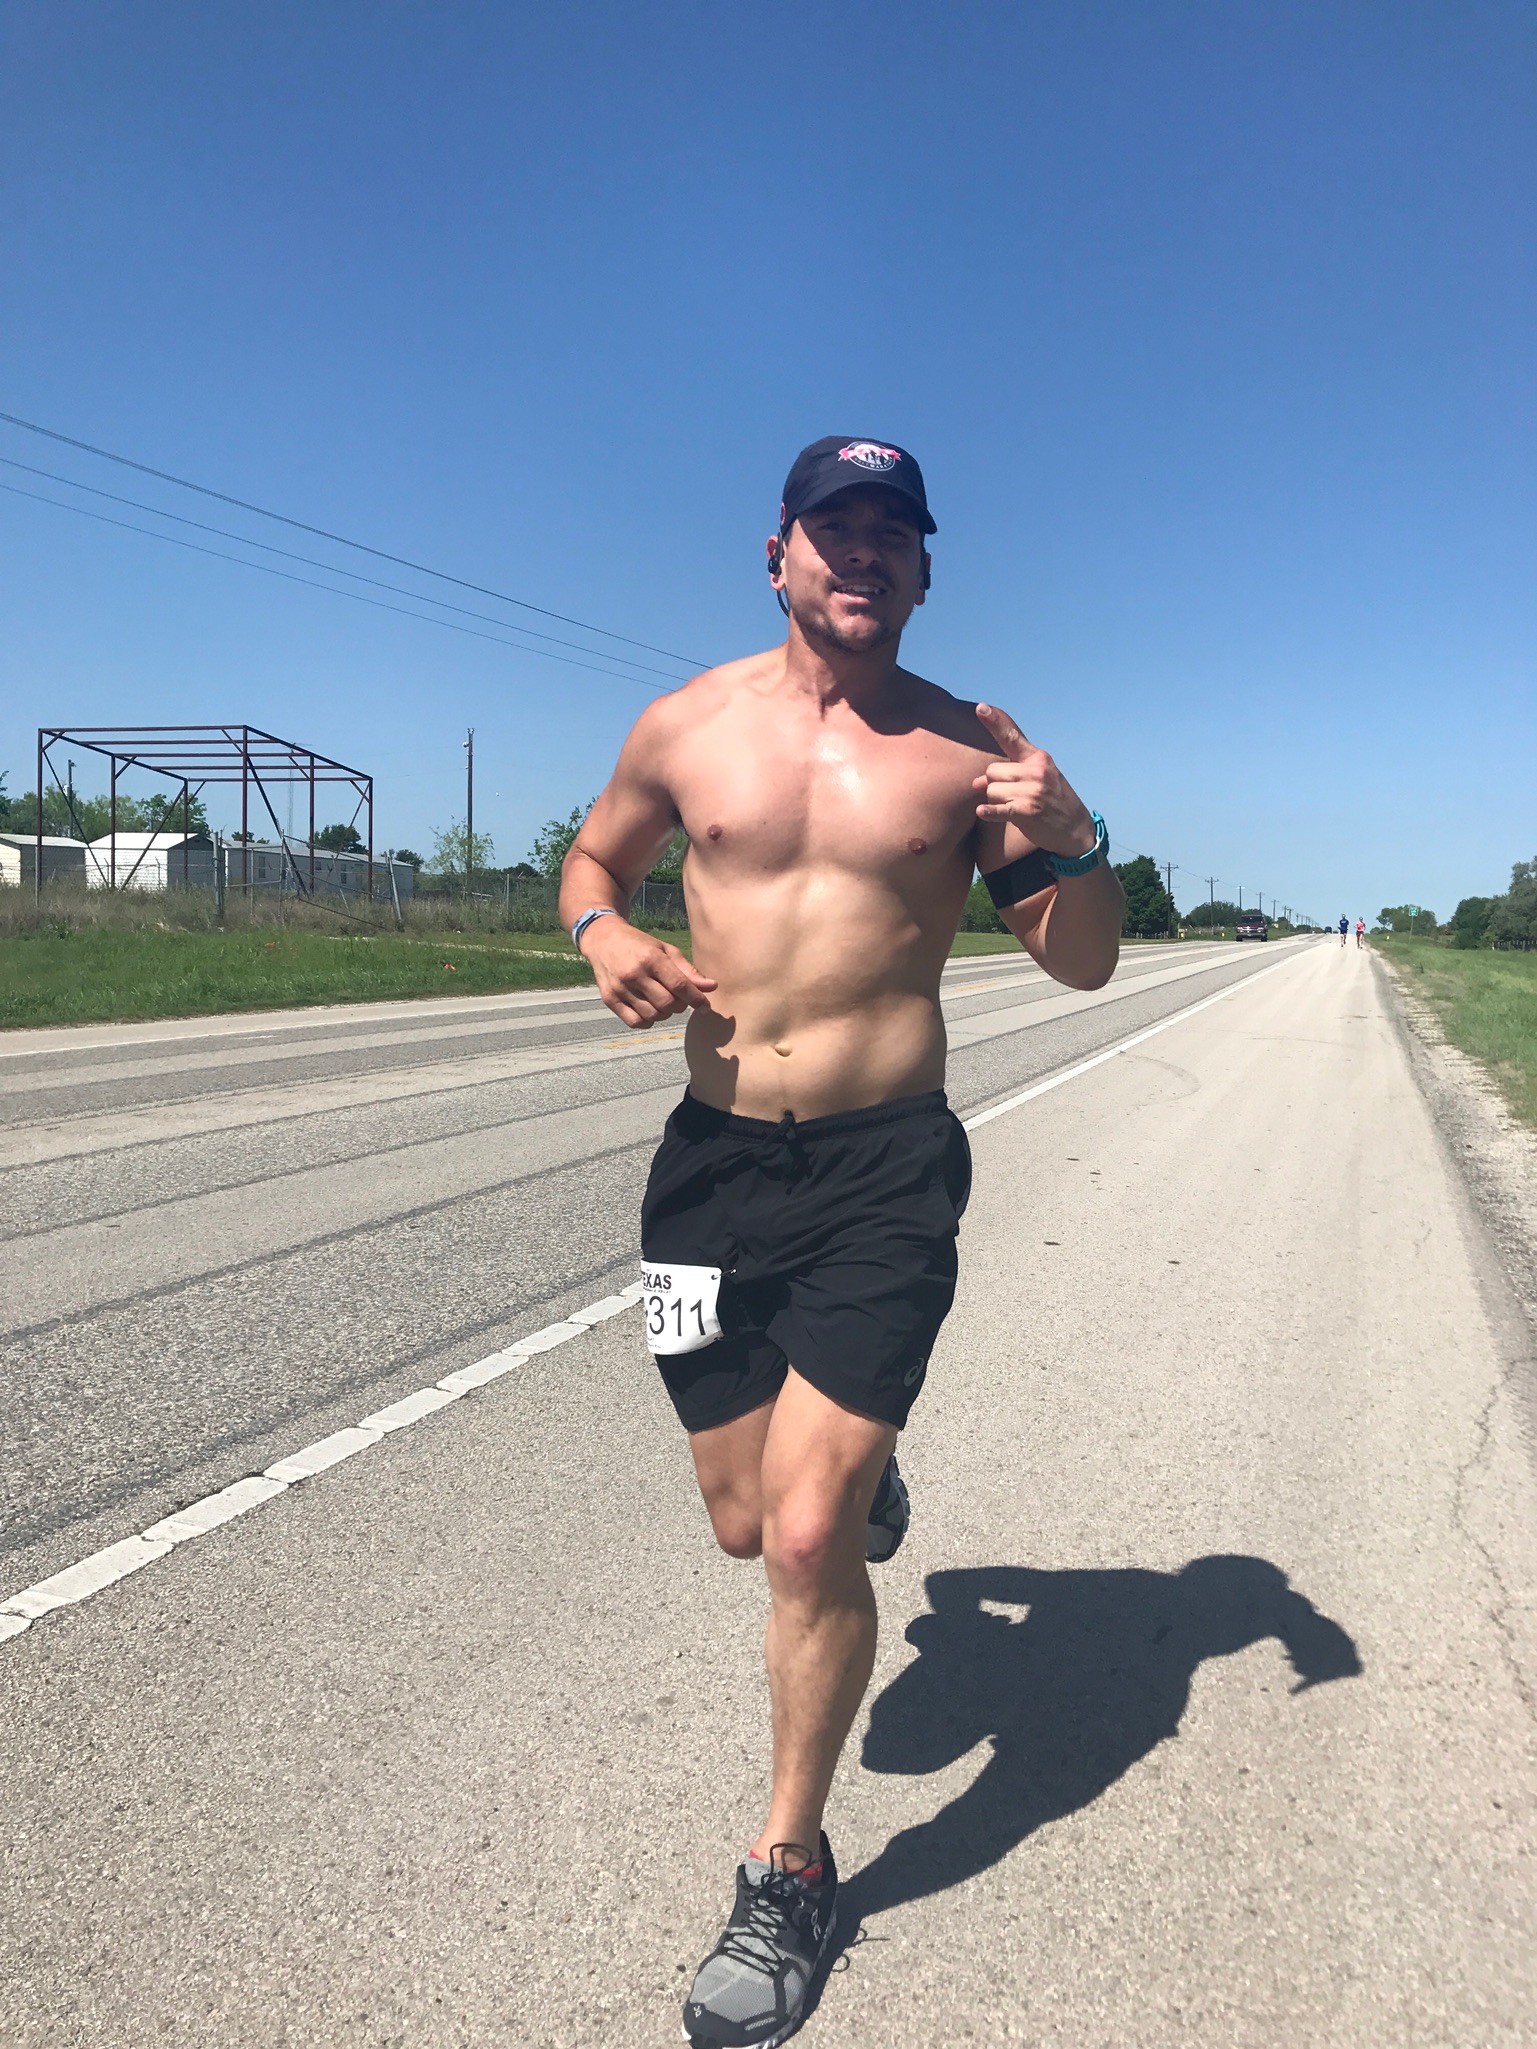
I started running again on June 22. The real ramp started August 1.
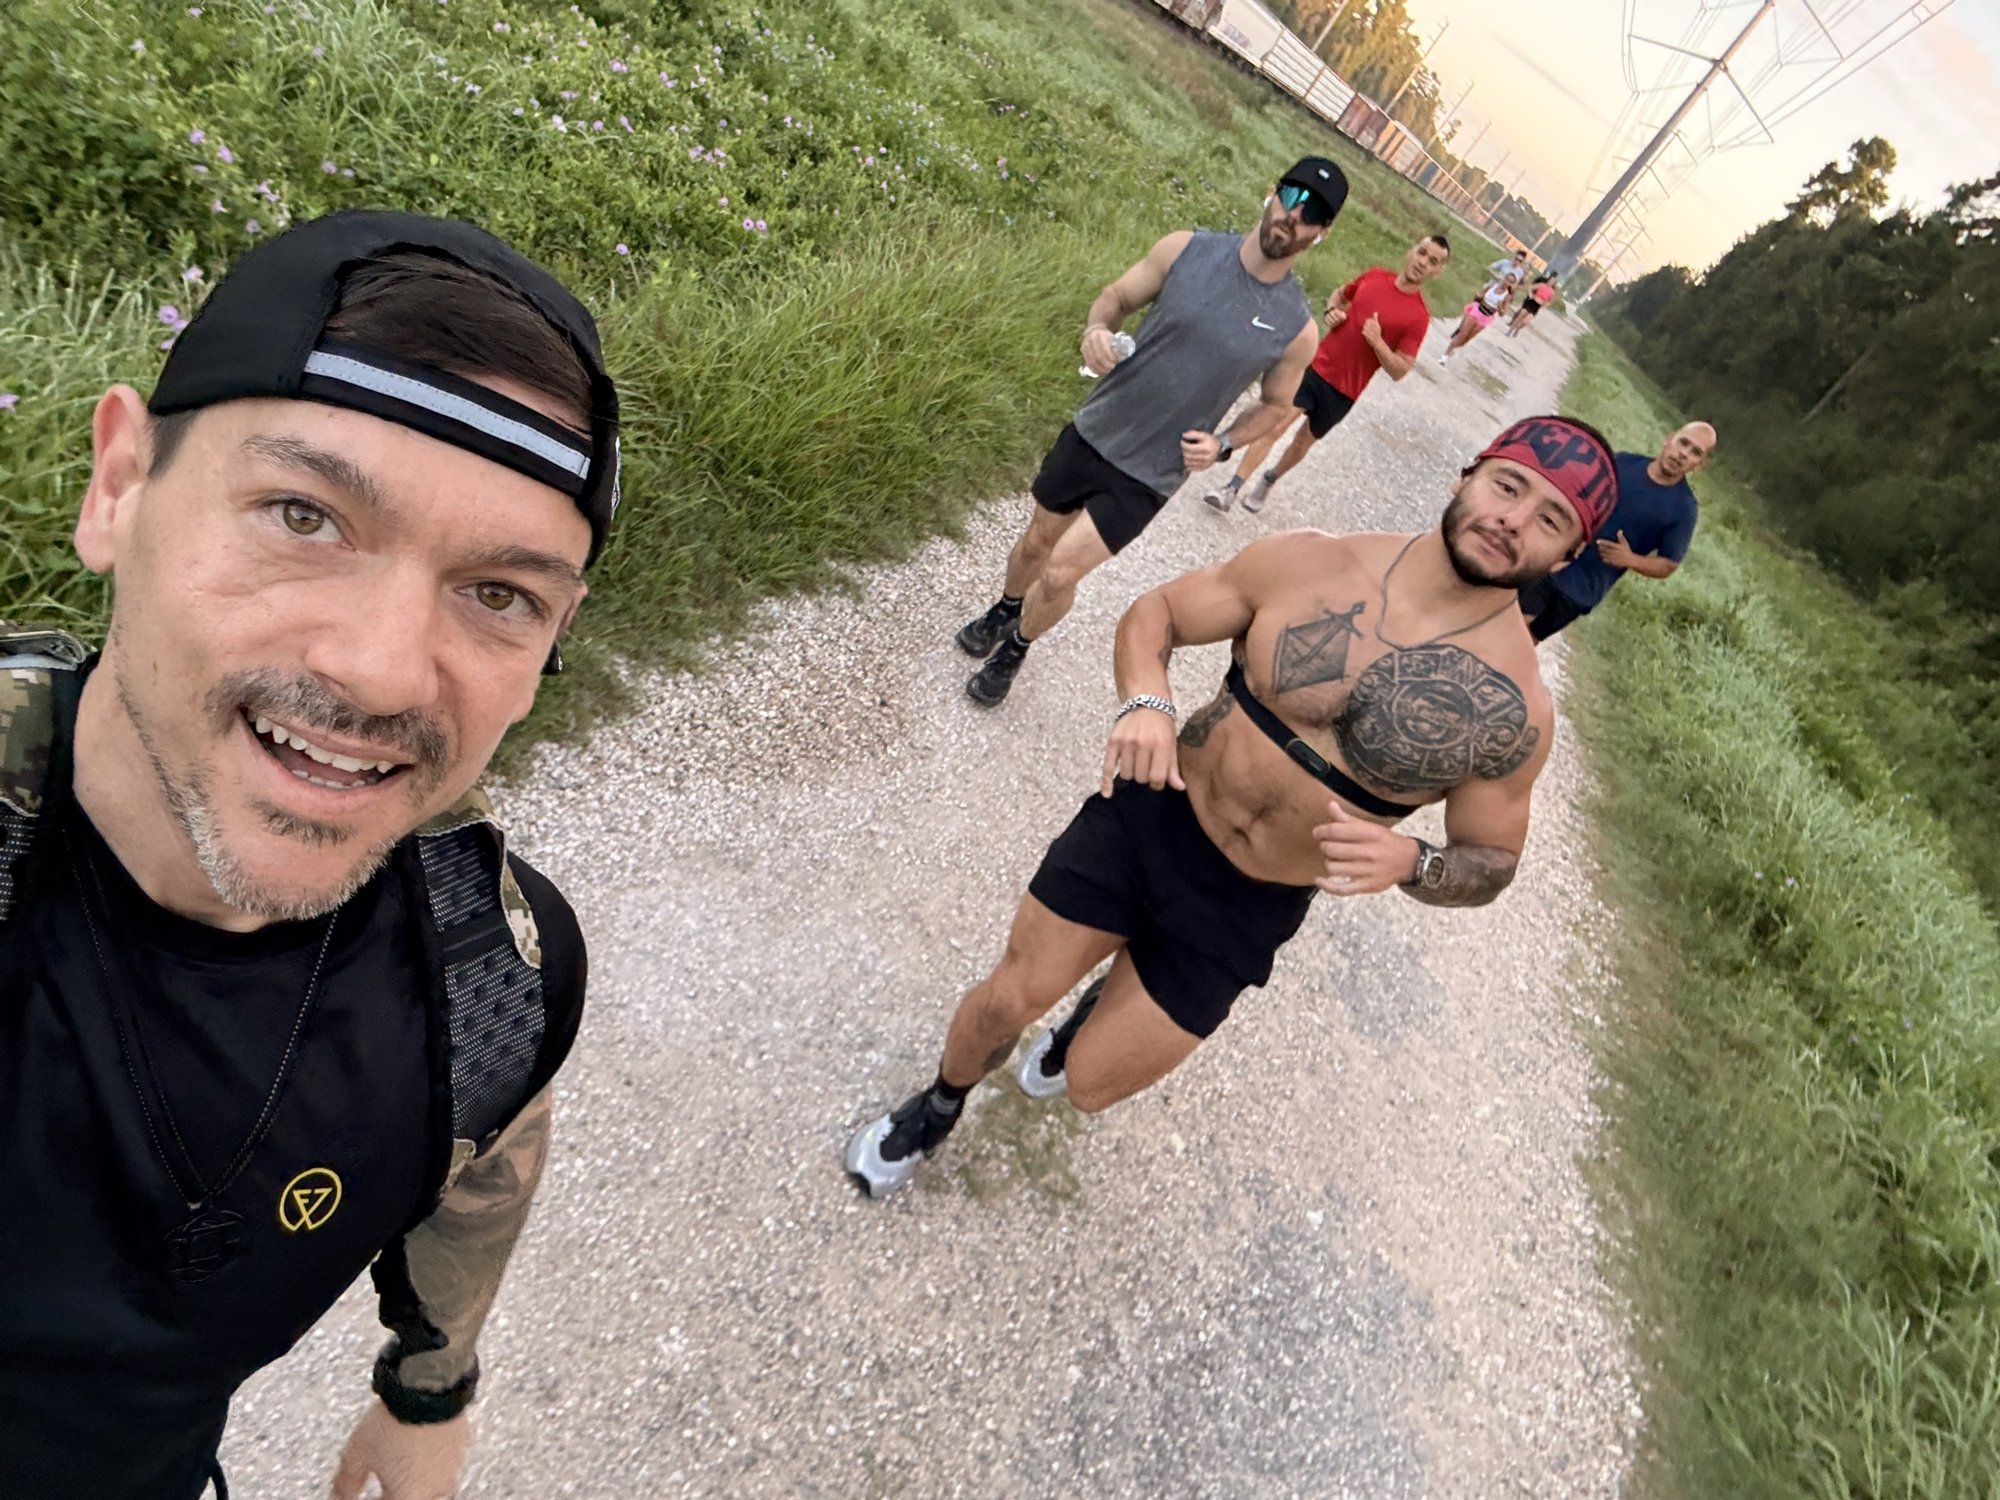
Since then I've been running 2 to 3 days a week with the Fitness Hippies on our F7 Bandera 50K Ramp Program, building toward race day on January 10, 2027. I pulled every run from my Garmin and laid it next to the last time I was in real endurance shape.
Here's what the data says.
Weekly miles, August vs October 4-week averages. 2.7x.
Long run, miles. Trail, Oct 25.
Garmin half marathon prediction, 2:05:09 on Aug 3 to 1:51:31 on Oct 26.
Runs per week, average since Aug 1.
Less running, more progress.
Three run days or fewer.
Three days a week or less was enough to nearly triple my volume and more than triple my long run in 13 weeks. No streak of five run days, no junk miles to hit a weekly number.
Weekly miles (gold bars) and longest run that week (line). Weeks starting Monday, Aug 3 to Oct 19, 2026. Source: Garmin Connect.
Fitness followed. My Garmin half marathon prediction sat at 2:05:09 on Aug 3 and was still 2:05:18 on Sep 14 while volume jumped. Then it dropped almost 14 minutes in six weeks to 1:51:31.
Garmin race predictor, weekly snapshots Aug 3 to Oct 26, 2026. Lower is faster. Garmin builds this prediction from its VO2 max estimate and recent training, so it's a model, not a race result.
Three months, three emphases.
All three phases, every month.
I didn't train every phase the same way every month. Each month had a primary focus, and the Garmin data shows it.
Base + tempo/threshold.
3 Aerobic Base, 7 Tempo, 1 Threshold run. 24% of run time in Zone 1-2, my most easy time of the three months, with 40% in Zone 4.
Speed + threshold.
2 VO2 Max, 1 Threshold, 3 Tempo, 4 Aerobic Base runs. Zone 5 hit 14% of run time, about 3x August and October.
Threshold primary.
6 Threshold, 4 Tempo, 2 Aerobic Base runs. 43% of run time in Zone 4, the highest of the three months.
Share of run time in each Garmin heart rate zone, per month. Run labels are Garmin Training Effect labels.
Speed builds the ceiling. Threshold closes the gap. Base builds the engine under both.
The threshold block.
And where it showed up.
I spent October working on threshold on purpose. Garmin tagged 6 of my 12 October runs as Lactate Threshold sessions, up from 1 in August and 1 in September.
It showed up in my Garmin half marathon prediction: almost 10 minutes faster across the four weeks of the block.
The long runs stayed base.
Threshold was the focus, not the only thing. Here's how Garmin scored my October long runs:
- Oct 15, 9.5 mi trail: Garmin rated it Aerobic Base, average HR 143.
- Oct 25, 13.1 mi trail: Garmin rated it Aerobic Base, average HR 137. By Garmin's HR zones, that same run was 84% Zone 3 and 10% Zone 1-2. In Speed, Threshold, Base, base lives in Zone 2 and 3.
- The rest of October: 8% of run time in Zone 1-2 and 5% in Zone 5.
Why an emphasis block works
Three things decide how fast you can run a long way: how big the engine is, how much of it you can hold, and how little oxygen each stride costs.1
Race pace = VO2 max x % of VO2 max you can hold x running economy
Grows the engine.
September's VO2 max work.
Uses more of it.
Threshold sets the share of VO2 max you can hold. That's the term October trained directly.1
Spends less per stride.
The strongest evidence for improving economy in trained runners is strength and short, hard uphill or plyometric work.3 That's the job of the strength days in the program.
Coyle's case study of an elite marathoner showed the same split. Over four years her speed at lactate threshold improved about 20% while her VO2 max did not change, with a separate gain of about 9% in economy.2
Concentrating on one quality for a block is called block periodization. A 2019 systematic review and meta-analysis found small but favorable gains over traditional mixed training.4 The studies were small, so treat it as support for the approach, not a guarantee.
So October did two jobs. Threshold sessions raised the pace I can hold, and the strength days kept building economy underneath it.
What held up.
The leading indicators.
In Run Better by Running Less I asked one question: is your resting heart rate elevated when you wake up? Here's my answer. No.
Resting HR (gold) and HRV (cream), weekly averages. Weeks starting Aug 3 to Oct 19, 2026. Weekly resting HR stayed between 40 and 44 bpm the whole ramp. HRV stayed inside my balanced range every week.
- Resting HR: about 41 bpm from August through October, even while volume nearly tripled.
- HRV: balanced every week from Aug 3 through Oct 28, peaking at 86 ms in late August.
- VO2 max: dipped from 49.5 to 49.0 through the late summer heat, then climbed to 50.2 by Oct 28.
Pain is a lagging indicator. These three are leading indicators, and none of them flashed red. Three run days a week gave my body time to absorb a near 3x jump in volume.
That's what makes an emphasis block safe: push one phase hard, keep the others in the week, and watch the leading indicators.

The 2017 Alaskaman build.
142.9 miles, one day.
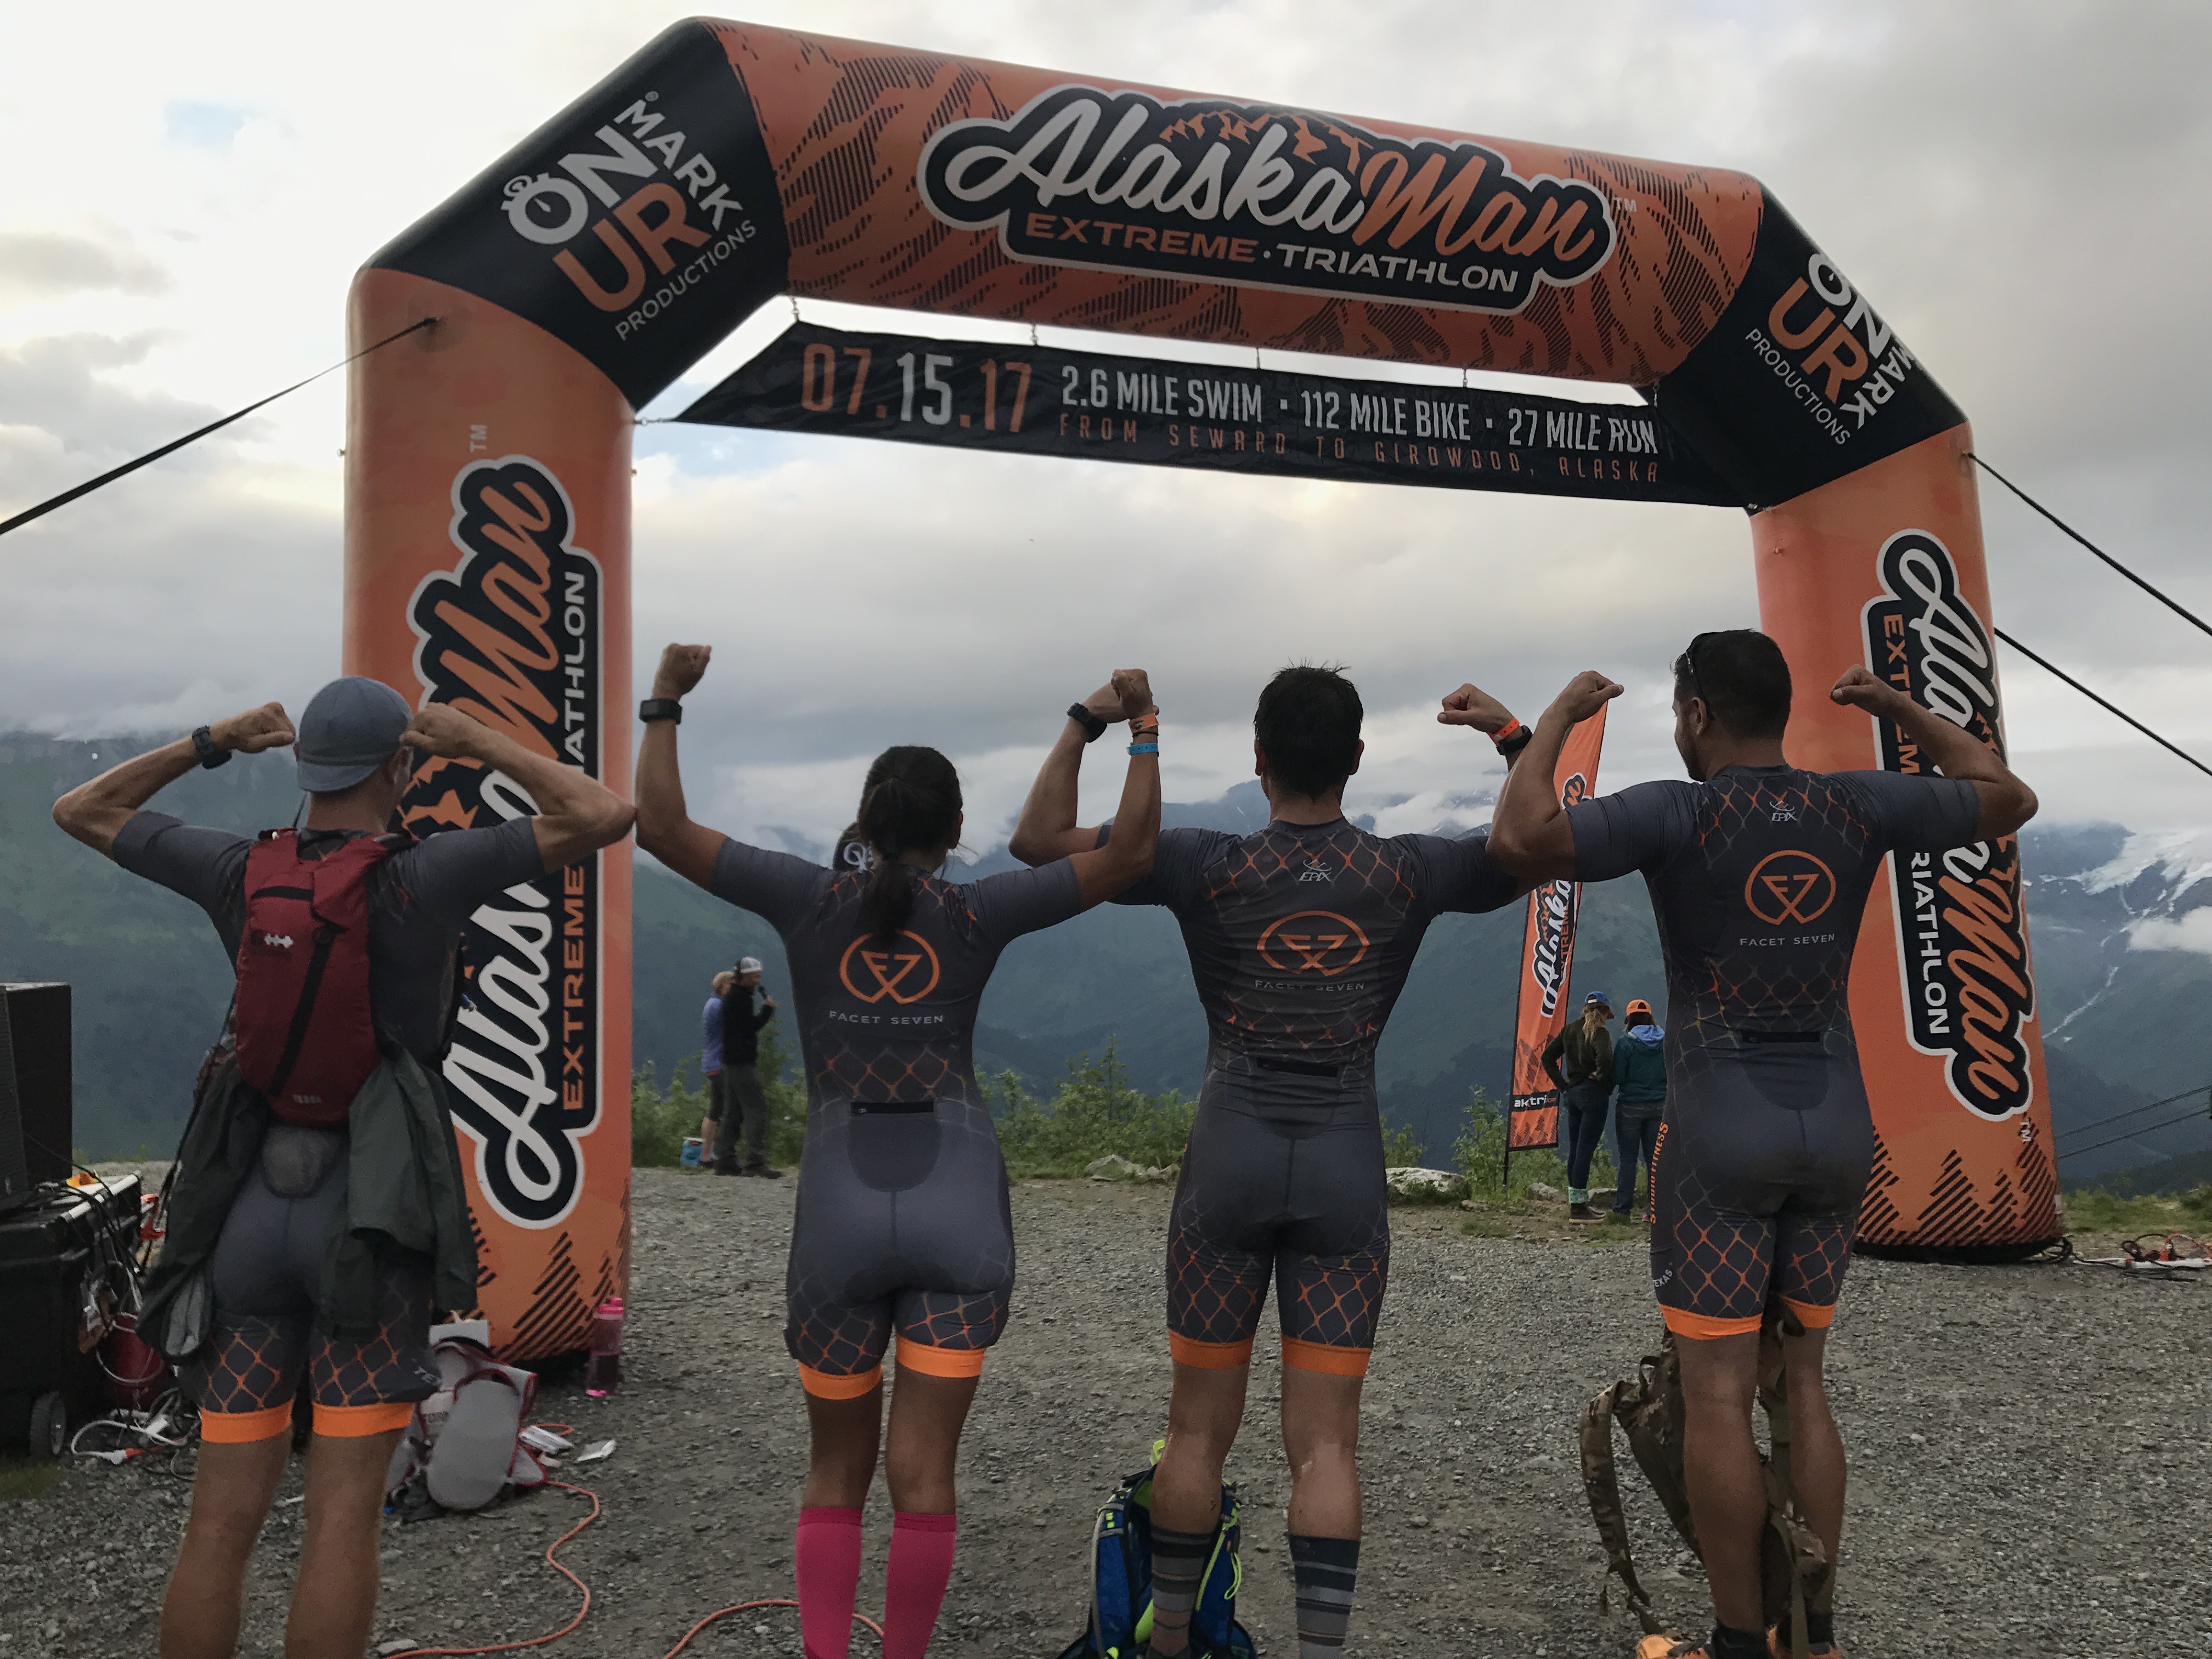
On July 15, 2017 I finished the inaugural Alaskaman Extreme Triathlon in Seward, Alaska. Here's the race from my old Garmin account.
Swim, 2.67 mi open water.
Bike, 111.2 mi, average HR 107.
Run, 28.5 mi trail, average HR 124.
Total, 142.9 mi with transitions.
The run averaged 15:57 per mile. That number hides the story. The first 11 miles averaged 9:54 per mile. The last 8 miles averaged 27:12 per mile, climbing about 4,500 feet on foot.
Pace per mile (gold bars) over the elevation profile (shaded). Garmin mile splits and elevation, Alaskaman run leg, July 15, 2017. Elevation in feet above the lowest point of the run. About 5,700 feet of total climbing by mile splits.
The builds, side by side
I compared the 15 weeks before that race (Mar 27 to Jul 9, 2017) with my last 4 weeks (Oct 1 to 28, 2026).
| Metric | 2017 build | Oct 2026 |
|---|---|---|
| Run miles per week | 19.3 | 22.0 |
| Runs per week | 3.5 | 3.0 |
| Run hours per week | 3.0 | 3.7 |
| Bike + swim hours per week | 9.5 | 0 |
| Total training hours per week | 12.6 | 3.7 |
| Longest run | 18.0 mi | 13.1 mi |
| Average run HR | 150 | 149 |
| Resting HR, average | 49 | 41 |
| Garmin VO2 max | 55 | 50 |
The run side is almost identical. Same miles, same run HR, slightly fewer run days now. The difference is everything around it.
- 2017 had 9.5 extra hours a week of bike and swim. My training rides averaged HR 131, about 19 beats below my run average, and race-day bike HR averaged 107. That was a lot of low-impact aerobic work without pounding my legs.
- 2026 is run-only cardio. The aerobic base has to come from the runs themselves, which is why the long runs stay base even in a threshold block.
- Resting HR is 8 bpm lower now than in 2017, 41 vs 49. These are different watches, so read it as a direction, not a lab number.
The F7 Bandera 50K Ramp Program.
Followed exactly as written.
Strong before long, fast before far still holds. The program is built on the same rules as the rest of this series.
- Strength 3 days a week with Wonderful Leg Wednesdays, so heavy legs land far from the weekend long run on both sides.
- 3 run days a week, with speed, threshold, and base all in the mix, and Sunday saved for yoga and mobility.
- Long run capped at 20 miles with a 35 mile peak week, so I get the volume without a single day that breaks me.
- Strength shifts to maintenance as run volume peaks, then tapers before race day.
Next up is the Bandera test run on Nov 15, then race day on Jan 10, 2027. Resting HR in the low 40s and HRV above 71 ms stay my green light to keep building.
Run Bandera with us.
January 10, 2027. Hill Country State Natural Area.
31 miles of rocks, sotol, and Hill Country grades. The Facet Seven Fitness Hippies are running the Bandera 50K, and there's room on the team. Join and you get the same Bandera 50K Ramp Program I'm running.
Pick the 50K, then join the Facet Seven Fitness Hippies team at checkout. Race details at tejastrails.com/bandera.
Runner questions, answered
Can you train for an ultra running 3 days a week?
In my build, 2 to 3 runs a week took my weekly miles from 8.2 to 22.0 and my long run from 4.1 to 13.1 in 13 weeks, with resting HR holding around 41.
What does threshold training improve?
Threshold raises the share of your VO2 max you can hold before you fade. Running economy improves most from strength and short, hard uphill or plyometric work.
Should every month look the same?
No. Keep speed, threshold, and base in every month, and give each block one primary focus.
How do I know if I'm overdoing it?
Watch your leading indicators: resting HR when you wake up, HRV, and how you feel starting a run. Pain is a lagging indicator.
The point
Speed, threshold, and base aren't a theory on a whiteboard. Run all three, give each block a focus, and the data shows it.
Run less. Train smarter. Recover on purpose. See you on the trail.
Know a runner chasing their first ultra?
Send this their way.

Movement for Life.
Cheers,
Layn Chess
Founder & Training Director
Facet Seven Fitness
- Joyner MJ, Coyle EF. Endurance exercise performance: the physiology of champions. J Physiol, 2008.
- Coyle EF. Physiological regulation of marathon performance. Sports Med, 2007;37(4-5):306-311.
- Barnes KR, Kilding AE. Strategies to improve running economy. Sports Med, 2015.
- Mølmen KS, Øfsteng SJ, Rønnestad BR. Block periodization of endurance training: a systematic review and meta-analysis. Open Access J Sports Med, 2019.
Data notes: all training numbers come from Layn Chess's Garmin Connect accounts (Aug 1 to Oct 28, 2026, and Mar to Jul 2017). Oct 29 to 31 was travel and is left out. Zones and Training Effect labels are Garmin's. VO2 max and race predictions are Garmin estimates; read the trend, not the single number. 2017 zone data was not recorded, and 2017 and 2026 used different watches. This post is education, not medical advice.
© CMV, LP. Facet Seven Fitness™ is a brand of CMV, LP